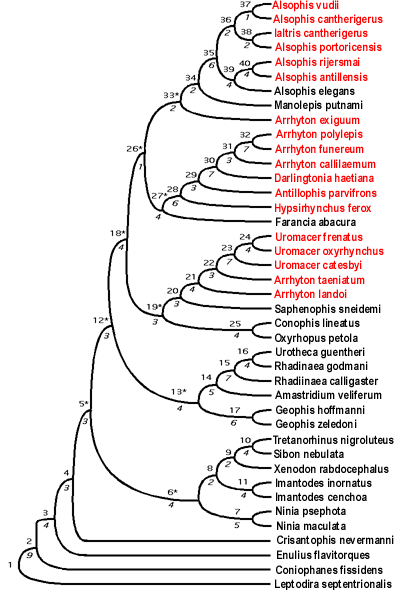
Figure 2. The single most parsimonious tree discovered in the successive approximations weighting analysis of the presence/absence coded data. The root is not shown (Appendix 3). The OTUs in red font are West Indian taxa.The numbers above the branches correspond with the branch numbers in Appendix 4. The italicized numbers below the branches represent the total character support for each node. Refer to Appendix 4 for specific character changes. The asterisked branch numbers represent the data subsets tested for structure with the g1 (all were significant).